Reading Serial data from a Raspberry Pi Pico

This post documents what I did to get serial data from my Pico to be stored/displayed on my PC (which could equally be a full Raspberry Pi)
The reason for this is that I have lots of cool components from my Maker Advent Calendar (sensors, screen, lights etc) and while they work nicely just on the Pico if I wanted them to save the data somewhere so I can display them on a web site you can’t do that in micropython – or so I thought.
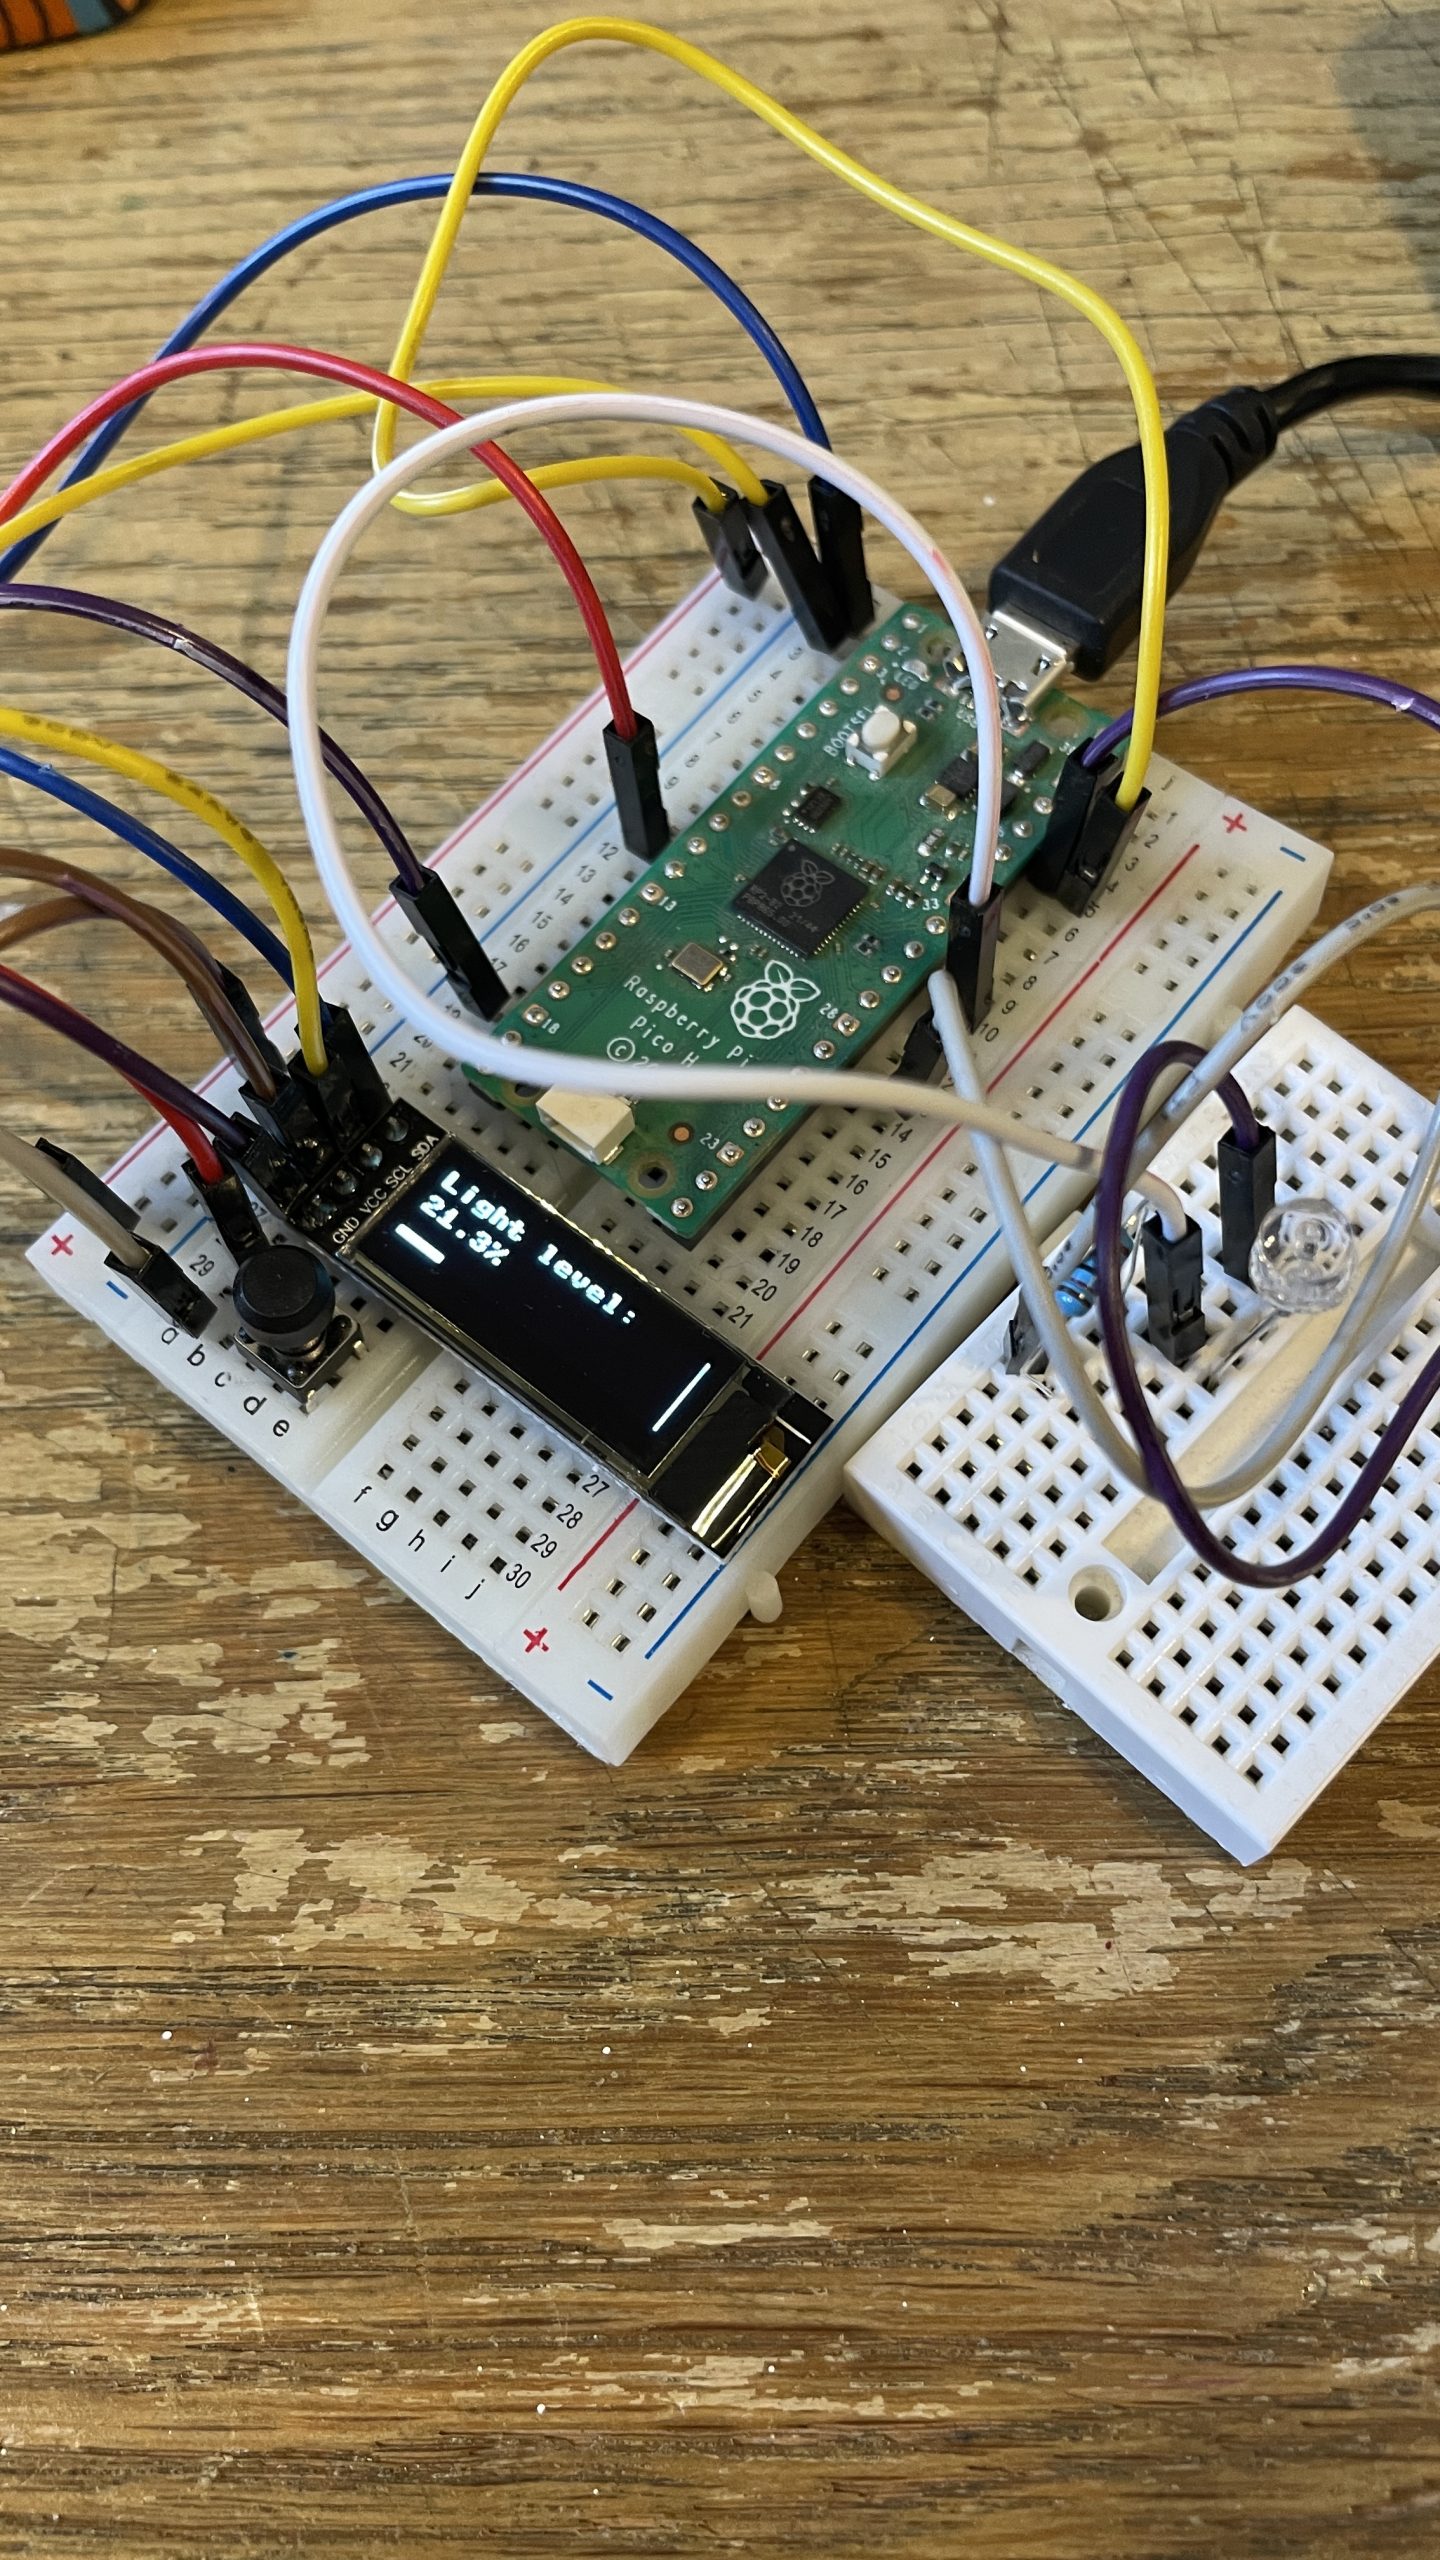
I started by following the instructions to get this little display attached to my Pico together with a light sensor to display current light readings.
https://thepihut.com/blogs/raspberry-pi-tutorials/maker-advent-calendar-day-11-omg-oled
I adapted it slightly to show a horizontal line as well (using this tutorial).
I then experimented with saving these readings into a text file – which worked moderately well but would be no good if you couldn’t get the data out of the file somehow.
So I did some research and realised I needed to use a serial connection (currently out of COM9 on my Windows laptop)
This article and video were very helpful https://www.hackster.io/shilleh/transfer-data-from-raspberry-pi-pico-to-local-computer-54ea9e
You basically need to create a main.py file on the Pico that runs the light sensor and prints the values to the console. But at the start of the program you use the following lines to establish a UART connection via serial over your COM port.
The dupterm() function basically duplicates the terminal output.
This originally caused problems for me as I got an error saying there was no such function. After a bit of research I realised I had a slightly older version of Micropython so downloaded the latest one here and dragged that onto the Pico (in BootSel mode – hold the Bootsel button down and reconnect)
Once that works without errors, close down Thonny and then just disconnect and reconnect the Pico. Because the code is in main.py it will automatically boot with this program.
Then you need to write a Python file to run on your main computer that will “Listen” out on the serial port for input. It can then save it to a file, display it on a screen or both.
My code is below.
#RASPBERRY PICO CODE - MICROPYTHON
# Imports
from ssd1306 import SSD1306_I2C #screen
import time
from machine import Pin,SPI,PWM,I2C,ADC
import machine
import framebuf
import utime
import uos


# need this UART to read from BME and be able to send data to local computer
uart = machine.UART(0, baudrate=115200)
uart.init(115200, bits=8, parity=None, stop=1, tx=Pin(0), rx=Pin(1))
uos.dupterm(uart)

# Set up I2C and the pins we're using for it
i2c=I2C(0,sda=Pin(0), scl=Pin(1), freq=400000)

# Short delay to stop I2C falling over
time.sleep(1)

# Define the display and size (128x32)
display = SSD1306_I2C(128, 32, i2c)

# Define pin for our sensor
lightsensor = ADC(Pin(26))

while True:

    # Delay
    time.sleep(0.5)

    # Read sensor value, turn it into a percentage, round to 1 decimal
    # Store this in a variable called 'light'
    light = round((lightsensor.read_u16())/65535*100,1)

    # Print the light reading percentage
    print("light sensor: " + str(light)+"%")

    # Clear the display
    display.fill(0)

    # Write two lines to the display
    # The line turns our light variable into a string, and adds '%' to the end
    display.text("Light level:",0,0)
    display.text((str(light) + "%"),0,12)
    #draw thick horiz line the length of the light %
    display.hline(0,29,int(light), 255) #draw horiz line
    display.hline(0,30,int(light), 255) #draw horiz line
    display.hline(0,31,int(light), 255) #draw horiz line
    display.hline(0,32,int(light), 255) #draw horiz line
    display.vline(127,0,32,255) #draw vertical bar

    # Update the display
    display.show()
#MAIN COMPUTER CODE - PYTHON
import serial

# Configure the serial connection
port = "COM9"
baudrate = 115200
serial_connection = serial.Serial(port, baudrate)

# Open a file on your computer to write the received data


# Read and write data until the transfer is complete
while True:
    data = serial_connection.read(21)
    if data == b"EOF":
        break
    print(data)
    destination_file = open("C:\\Users\\CeX\\Desktop\\store_info.txt", "a+b")
    destination_file.write(data)
    destination_file.close()

# Close the files and serial connection

serial_connection.close()
Next steps:
Make a webpage that displays the data as a graph (using some Javascript perhaps? I know you can make nice graphs with Google Charts)